I am a visual learner/thinker which means I love charts and graphs and really any visual product tied to markets. I read the Daily Chartbook and The Daily Shot like many and I love both and find them worth every penny. But I also stumble upon dozens of charts every day that I think are great and readers of those and other products may be missing. So I decided to start sharing a few here as an experiment. I wanted to see if A) I have the time to put this together and B) if folks wanted to read it and yes…pay a few bucks for it in the future. So I will likely do this for a few days or weeks and then decide whether to put it into stone in my daily process. My aim here is to present 10-30 charts on most market days and for most of them to not have overlap with other daily chart services.
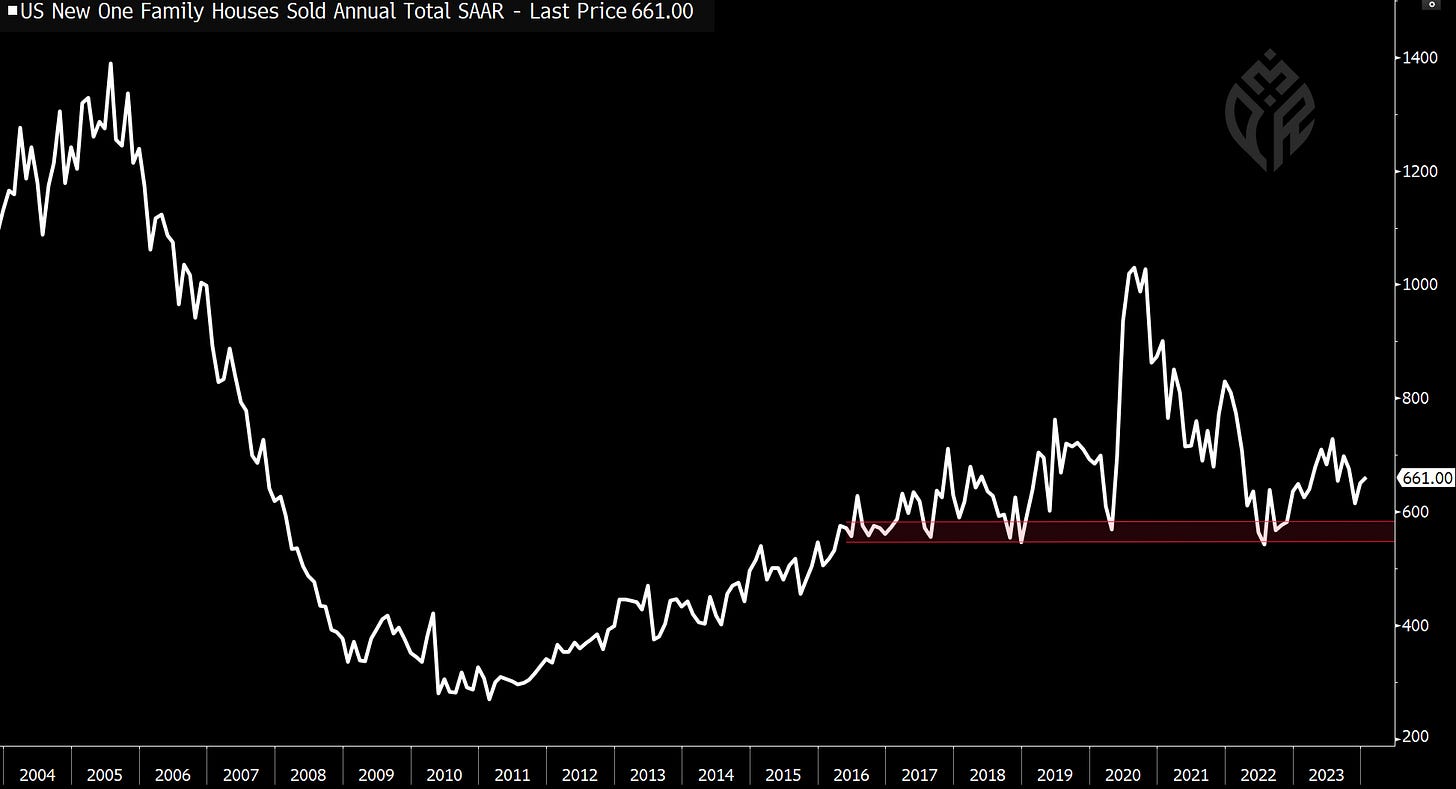
Today, we had weak US new home sales, a beat for Dallas Fed Manufacturing, and hot inflation in Japan.
Home sales off the lows but still not great and under expectations.
First green new orders for the Dallas Fed since May of 2022 - the manufacturing rebound continues.
The business activity forecast was the best since March of 2022.
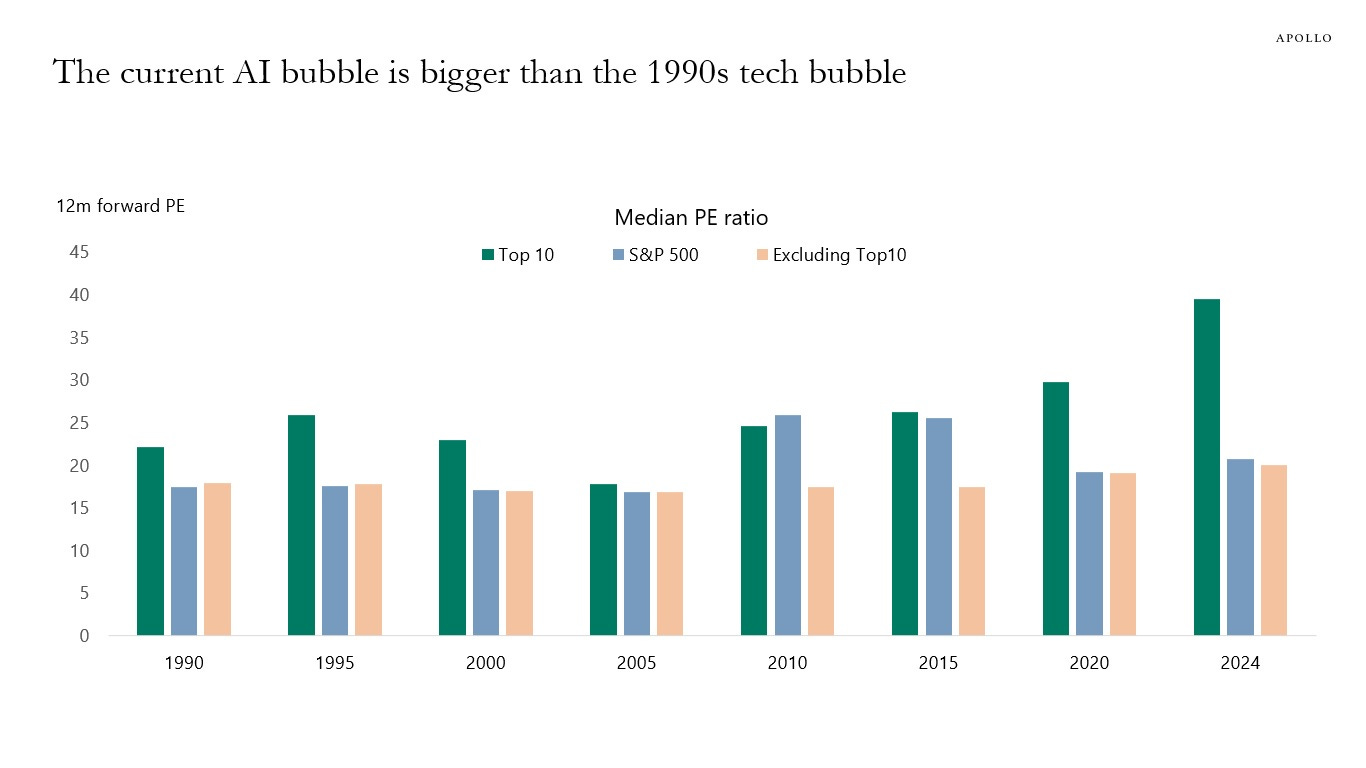
We have heavy concentration into very expensive stocks.
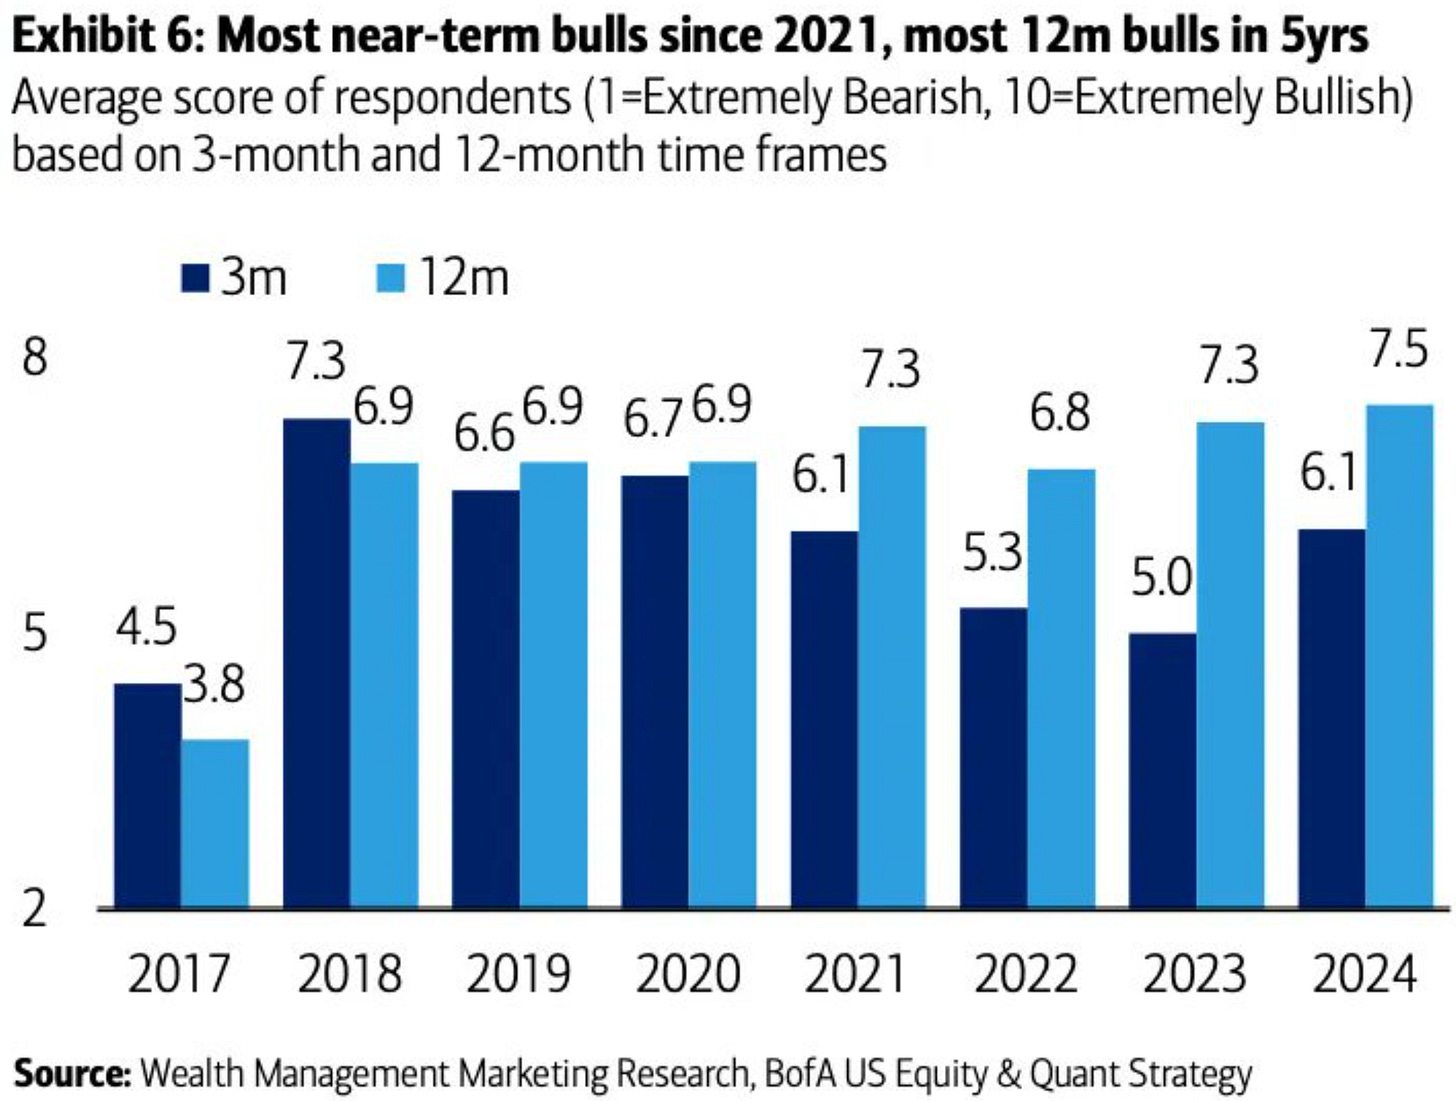
Folks are bullish. Very bullish.
US banks hold $1.40 in reserves for every dollar of delinquent commercial real estate loans (was $2.20 last year). This has to come up with cuts…much less without cuts.
Advisors have almost none of their client’s money in gold and are showing very little interest in increasing that number.
We have gone from largely confirming here to a little more neutral.
Some of my internal measures are less supportive going back to the beginning of 2022 but clearly Macro Ops’ dashboard here has worked better in recent months. The Pressure Index uses Dollar/Rates/Oil.
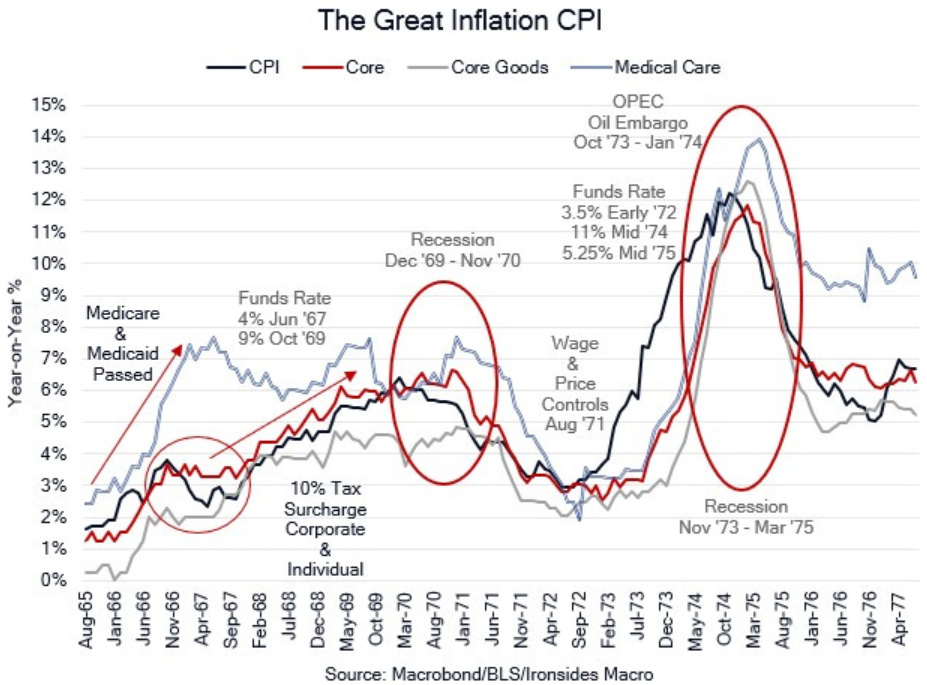
I love this chart from Barry Knapp. Barry has a strong and differentiated view of the great inflation of the 70s and the fiscal role that was played. Specifically the Great Society policy changes that pressured medical care inflation which pressured CPI.
Nickel prices trying to bottom here and lithium has bounced off strong support in the last month. Something to keep an eye on.
CrossBorder has US deficits sticking around 7-8% of GDP after this year’s move back to around 6%.
We got to nearly 7 cuts for 2024 and now we are nearly back to the Dot Plot’s 3. We may dip under 3 on strong data before we see weakness (higher rates maybe?) take rate cuts back over 4.
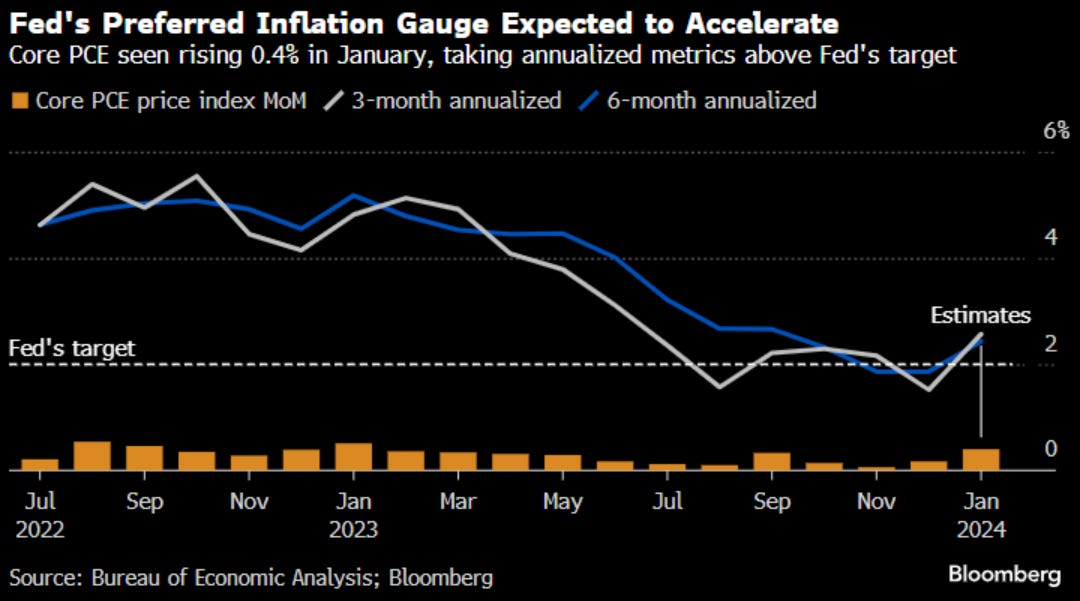
Core PCE will be at an annualized 4.8% per expectations and the 3M and 6M annualized numbers will be back above target. This becomes a tougher sell for the Fed’s communication game if they want to cut before Q3. Moving the wrong direction away from the target is not exactly data confirming the recent trend lower (thanks goods and energy!).
The replacement rate is 2.1 and globally we are at 2.3 which is roughly half of where we were 50 years ago.
New high for the 1yr inflation swap. Like 6M annualized core PCE the Fed was excited about this when it was at 2% and now it is at 2.44%.
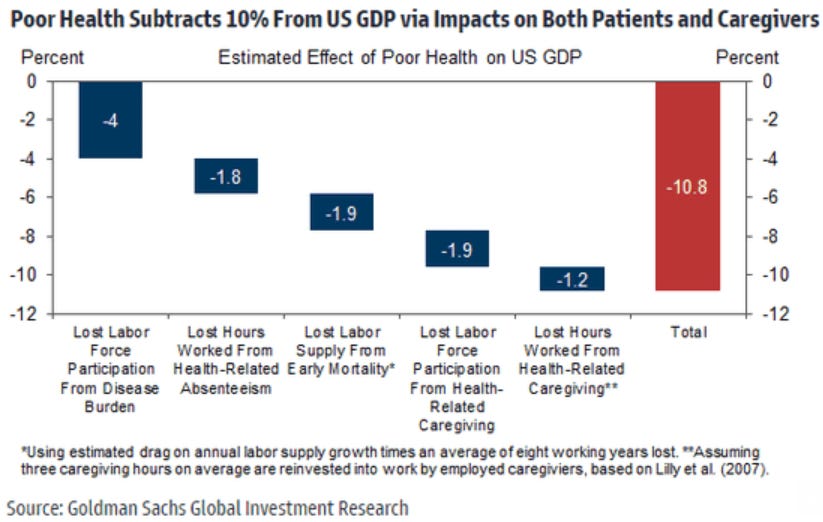
If poor health takes over 10% from GDP - we should be able to increase productivity by a lot if we can increase health via new treatments.
Disclosure: Pinecone Macro Research, LLC is an independent research firm. Pinecone Macro’s letters are based upon information gathered from various sources believed to be reliable but are not guaranteed as to accuracy or completeness. There are risks in investing. Any individual report is not all-inclusive and does not contain all of the information that you may desire in making an investment decision. You must conduct and rely on your own evaluation of any potential investment and the terms of its offering, including the merits and risks involved in making a decision to invest. The information in this letter is not intended to be, and shall not constitute, an offer to sell or a solicitation of an offer to buy any security or investment product or service. The information in this report is subject to change without notice, and Pinecone Macro Research, LLC assumes no responsibility to update the information contained in this report. There is risk in trading markets. Pinecone Macro Research, LLC is not an investment advisor. The ideas and trades I share are my own and are for informational and educational purposes only and should not be construed as investment advice. Accordingly, you should not rely solely on the information in making any investment. You should always check with your licensed financial advisor to determine the suitability of any investments.


